Content:
- Usage of function
MT5.GetSymbol(). - How long it takes.
- Check the data.
- Plotting it.
- Using
bDeletecsv = FALSE.
Load mt5R.
library(mt5R)
Let’s check if mt5R in MT5 plataform is listening.
MT5.Ping()
#> [1] TRUE
Everything is fine! Let’s continue.
To reasonable size of data the best practice is to use the function MT5.GetSymbol(). To small chunks try MT5.Quick_GetSymbol() instead.
To obtain all the available data use iRows = Inf (mt5R 0.1.3 or newer versions), iTF = 1440 is to obtain daily data, check ?MT5.GetSymbol for other availables timeframes.
TimeStart <- Sys.time() ## Lets check how long it takes. Starting the chronometer!
EURUSD <- MT5.GetSymbol("EURUSD", iTF = 1440, iRows = Inf, xts = TRUE)
TimeEnd <- Sys.time() ## Saving the time when it ended
Finally!
It’s a huge dataset. Lets get a closer look - how long it took to download all the data?
print(TimeEnd-TimeStart)
#> Time difference of 10.06714 mins
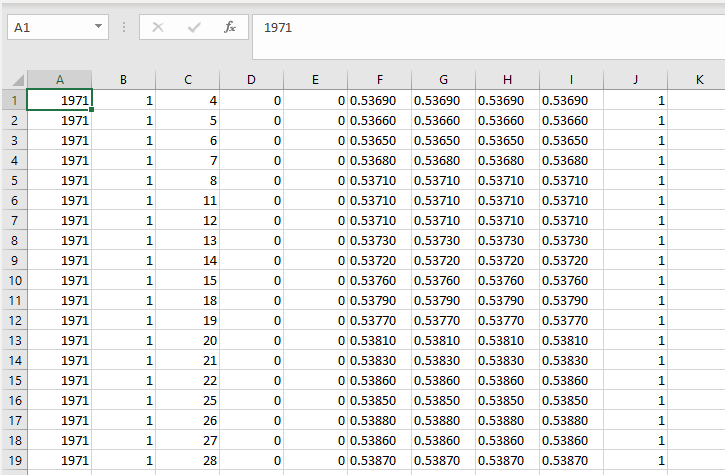
The time requirement scales linearly, it will takes considerable amount of time for very huge datasets - since a .csv is created and the data is stored. To quickier load of data use MT5.Quick_GetSymbol() instead.
Check dimensions of Data.
dim(EURUSD)
#> [1] 12910     5
It’s 12,910 days of OHLC data.
Let’s check the first lines of EURUSD.
head(EURUSD)
#>              Open   High    Low  Close Volume
#> 1971-01-04 0.5369 0.5369 0.5369 0.5369      1
#> 1971-01-05 0.5366 0.5366 0.5366 0.5366      1
#> 1971-01-06 0.5365 0.5365 0.5365 0.5365      1
#> 1971-01-07 0.5368 0.5368 0.5368 0.5368      1
#> 1971-01-08 0.5371 0.5371 0.5371 0.5371      1
#> 1971-01-11 0.5371 0.5371 0.5371 0.5371      1
Let’s check the end lines of Data.
tail(EURUSD)
#>               Open    High     Low   Close Volume
#> 2021-02-05 1.19608 1.20492 1.19513 1.20478  61583
#> 2021-02-08 1.20367 1.20651 1.20188 1.20461  56331
#> 2021-02-09 1.20460 1.21208 1.20389 1.21188  63188
#> 2021-02-10 1.21190 1.21432 1.21078 1.21180  60820
#> 2021-02-11 1.21181 1.21485 1.21126 1.21303  48820
#> 2021-02-12 1.21305 1.21339 1.20805 1.21187  53686
You can plot the EURUSD using quantmod package.
library(quantmod)
quantmod::chartSeries(EURUSD)

To make EURUSD obtained available to other softwares (Python and etc), use argument bDeletecsv = FALSE in function MT5.GetSymbol(). See example below.
EURUSD <- MT5.GetSymbol("EURUSD", iTF = 1440, iRows = Inf, bDeletecsv = FALSE)
The .csv table downloaded will be stored in Files MT5’s folder. To find out specifically where it is located use the function MT5.FileWorkingFolder().
MT5.FileWorkingFolder()
#> [1] "C:\\Users\\GKIN\\AppData\\Roaming\\MetaQuotes\\Terminal\\FB9A56D617EDDDFE29EE54EBEFFE96C1\\MQL5\\Files\\"

